The NBA season tipped off last night, so it's safe to say that basketball is back! The games themselves will be incredible, but at the center of math, we think that the statistics are pretty interesting as well. We know the basic stats - points, assists, rebounds, etc. - but what about the advanced stats? Here's a quick peek at advanced stats in the NBA - and what they measure!
Player Efficiency Rating (PER)

This stat was created by John Hollinger, a basketball analyst, as a statistic that measures how efficient a player is. It is often confused as a stat that measures everything about a player, but even Hollinger has admitted that it can't do this. What this statistic essentially does is take into account how many good things a player does (points, assists, rebounds, blocks, steals, field goals made, etc.), subtracts the bad things a player does (turnovers, missed field goals, etc.), and take into account the number of possessions used by a player (as well as how fast or slow their team plays) to arrive at one number. The statistic tends to undervalue good defenders, because while blocks and steals offer some measure of how good a player defends, it certainly doesn't measure how good a defender is. The complete calculations can be found here. The average player is supposed to have a PER of 15. The league leader last year was Giannis Antetokounmpo (above), the league MVP, who has a PER of 30.89. The best season ever was Wilt Chamberlain in 1962-63, when his PER was 31.82.
Win Shares

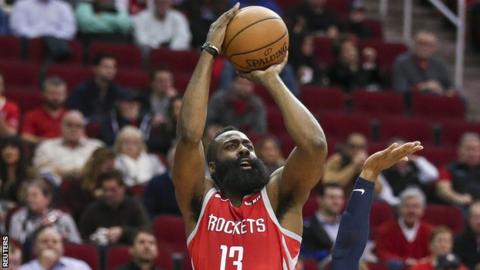
Like PER, Win Shares is a statistic that tends to figure out how efficient a player is. However, unlike PER, Win Shares take playing time into account. Let's say a player plays two minutes, and in this time scores two points and gets a rebound. This is a remarkably efficient line, and PER would reflect this by rewarding the player with a high number. However, the numbers would be essentially unsustainable if taken over a longer period of time (the numbers extrapolated over 36 minutes, roughly what an NBA starter plays per game, are 36 points and 18 rebounds per game, totals only reached by the same player in one season by Wilt Chamberlain). Win Shares, on the other hand, would reward this efficiency and small sample size, but not too much. It rewards efficiency, but also quantity of time played. The calculations behind Win Shares can be found here. The leader in Win Shares last year was James Harden (above) with 15.2 Win Shares. The best season all time for Win Shares was by Kareem Abdul-Jabbar in 1971-72, with 25.37 Win Shares.
True Shooting Percentage (TS%)

Steph Curry is considered to be one of the best shooters ever. However, last season, he ranked 57th in the league in field goal percentage. Why is that? The further away from the hoop, the harder it is to score. (This is why people win thousands of dollars for half court shots, but rarely do so for layups) Curry tends to shoot the ball further away from the hoop - namely three pointers, a shot that is more valuable than a two point shot. True shooting percentage takes into account all types of shots (two pointers, three pointers, and free throws) and weights them to arrive at a number that is a more accurate measure of how good a shooter a player is. While Curry ranked 57th in the league in shooting percentage last year, he ranked 7th in TS%. The formula for calculating TS% can be found here. The leader in TS% last year was Rudy Gobert (above) with .682. The all time best season in TS% was .7082, done in 2011-12 by Tyson Chandler.
Box Plus-Minus (BPM)
Plus-Minus is a fairly elementary stat. It simply states how much better the team did with a player on the floor. If Lebron James enters a game tied 50-50 and leaves with his team leading 67-62, his plus minus is equal to +5. However, this stat can be misleading as well. It would be far harder to score on an all star team than against the back ups of the worst team in the league. BPM takes this into account, resulting in a statistic that measures how good a player would be when paired with 4 average players against 5 average players. The methodology behind it can be found here. The leader in BPM last year was James Harden with a BPM of +11.7. The all time best season in BPM was from Russell Westbrook (above) in 2016-17, which was +15.6.

No comments:
Post a Comment